ALFANO SA
ALFANO DATA ANALYSIS

Download below the APPs for free

ADA PRO Windows

ADA Windows

New

ADA-PRO, the new Windows software
ADA-PRO: The essential tool for motorsport engineers.

With ADA-PRO, our new intuitive and powerful software enables you to analyze your driving and vehicle behavior in depth, to identify strengths and areas for improvement, and to make informed decisions to optimize your performance.

ADA-PRO offers a complete range of data for performance analysis, from basic parameters (speed, RPM) to more specific measurements such as G-force, lambda, pedal movement, steering wheel movement, exhaust temperatures, tire pressures and temperatures.

ADA-PRO provides easy-to-understand graphical and numerical visualization. For more demanding users, ADA-PRO also features mathematical channels. An undeniable asset for fast, precise data understanding.

RPM + LAMBDA LSU 4.9

Tire pressures and temperatures (internal) for the entire session.

More examples coming soon

ADA
Viewing and selecting sessions. You can sort your sessions by date, by driver, by circuit, by category, also filter the sessions according to several criteria in order to see only the desired sessions. For each session, several functionalities are then proposed, with the details of your laps, sharing the session, adding to favorites, session details.
ADA
Select a country and view all available tours for that country in the Alfano 6, Alfano 7 database (*function only available for ALFANO 6, ALFANO7). For each tour, you can see the default number of partials, or view the tour on Google Earth.
ADA
Analysis of your ALFANO's RPM regime. Different functionalities give the possibility to change the amplitude of the RPM slices, to see the acceleration and deceleration zones, you can change the color, cumulate the RPM slices, hear the histogram and much more!
ADA
Analysis of the gearbox. Different functionalities give the possibility to change the color, or to take into account the analysis on the whole lap or only during acceleration phase.
ADA
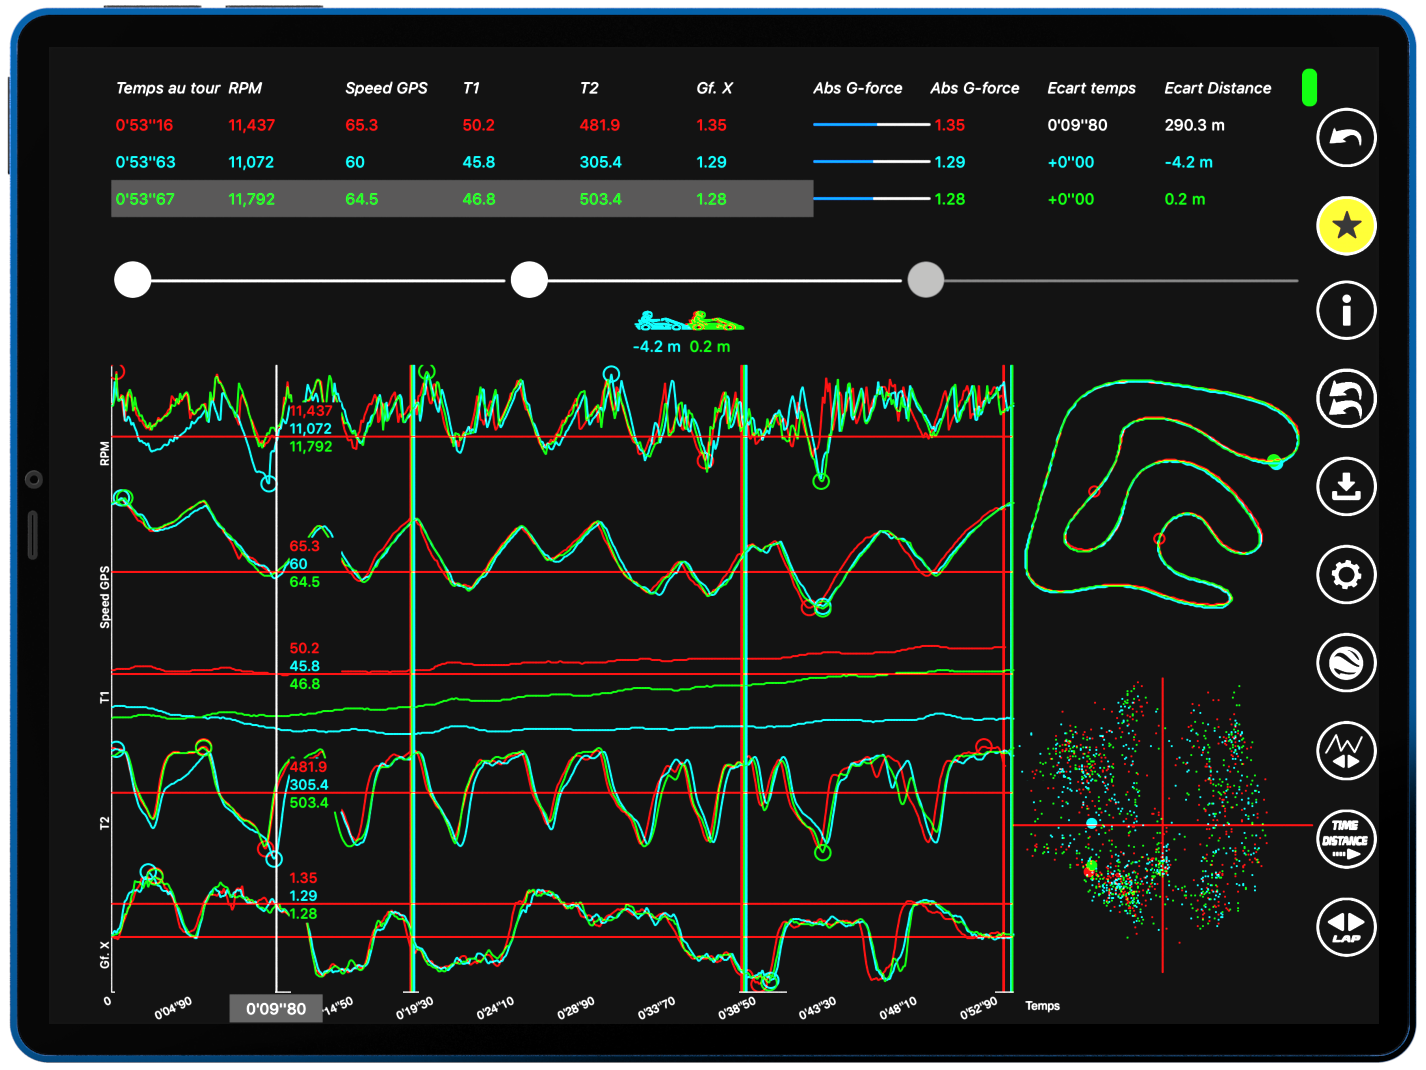
Analysis of your towers in graphical form. You can visualize all the samples of your sensors, the track layout, the G-force, the gap between the different laps of the different sessions. You can also zoom in, insert several parameters in order to precisely target your analysis. Several functionalities are available on the right to access other specific pages depending on the desired analysis.
ADA
Analysis of your engine power. This is displayed as a histogram graph and you can compare RPM acceleration and speed acceleration. You also see the acceleration areas on the track for each lap selected.
ADA
This is the ADA overview page. You can access session selection, data download and parameter settings from this page.
ADA
Viewing and selecting sessions. You can sort your sessions by date, by driver, by circuit, by category, also filter the sessions according to several criteria in order to see only the desired sessions. For each session, several functionalities are then proposed, with the details of your laps, sharing the session, adding to favorites, session details.
ADA
Analysis of the maximum and minimum of all your sensors. You also have the possibility to see for each maximum or each minimum of one of your sensors the location on the circuit and the value of the other sensors at this location. The display of this maximum or minimum appears on the circuit.
ADA
Analysis of your towers in graphical form. You can visualize all the samples of your sensors, the track layout, the G-force, the gap between the different laps of the different sessions. You can also zoom in, insert several parameters in order to precisely target your analysis. Several functionalities are available on the right to access other specific pages depending on the desired analysis.
ADA
Analysis of your ALFANO's RPM regime. Different functionalities give the possibility to change the amplitude of the RPM slices, to see the acceleration and deceleration zones, you can change the color, cumulate the RPM slices, hear the histogram and much more!
ADA
Visualize the movement of several drivers or several laps from different sessions on Google Earth, displaying trajectories and sensor values simultaneously. You can scroll through your laps at real speed, or move manually along the route of your laps.
ADA PC
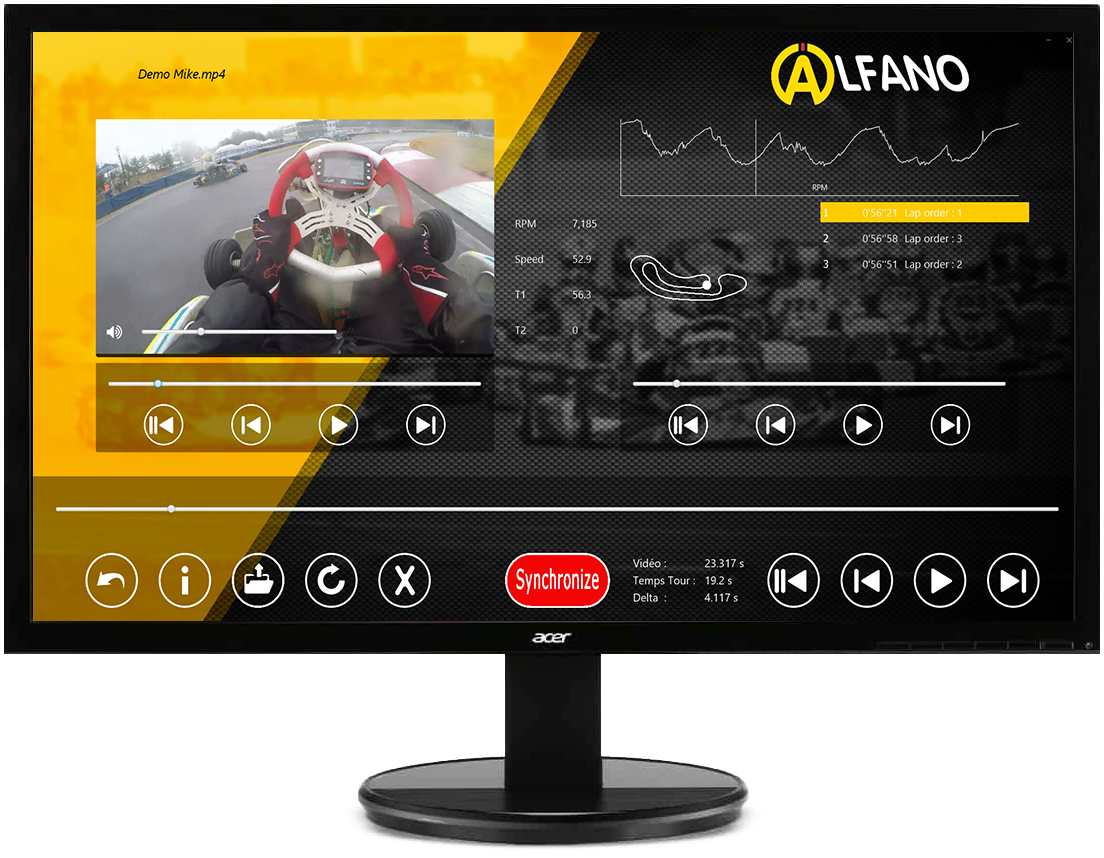
Synchronize your session with your video from a camera (example GO Pro). Your data and your synchronized video will then appear in the graphical analysis menu (*only available on Windows PC).
ADA PC
Analysis of your towers in graphical form. You can visualize all the samples of your sensors, the track layout, the G-force, the gap between the different laps of the different sessions. You can also zoom in, insert several parameters in order to precisely target your analysis. Several functionalities are available on the right to access other specific pages depending on the desired analysis.
If you have synchronized a video with your session, you can display it simultaneously with the graph (*only available on Windows PC).